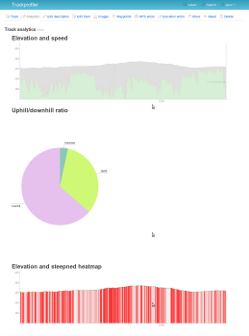
With a new version -- one new feature. Graphs for every track uploaded. At the moment, there are three kind of graphs:
- Graph with elevation and speed,
- Uphill/downhill ratio,
- Elevation and steepness heatmap.
I'll probably add more in the future.
PS. The library used or generating the graphs is now open source: see cartesius on github.
PS. The library used or generating the graphs is now open source: see cartesius on github.
