Sunday, 28 July 2013

Print only selected track elements

From now on, you can decide which elements to include when printing the track:


Feedback is welcome.

Wednesday, 24 July 2013

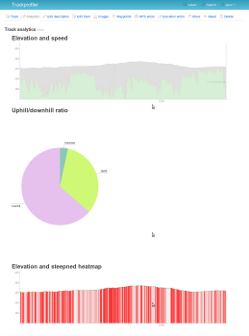
New layout for GPS track analytics page

There was a few deploys with loads of new features on trackprofiler in the last few months. This is the first of a series of blog posts covering new features introduced lately.

If you remember, the original "Track analytics" page was just a series of graphs. Yesterday a new version was rolled out with the new version:


For every graph you can see:
  • Elevation graph
  • Speed graph
  • Steepness graph
For every graph by moving over it -- you can see exactly on the map where that point was recorder. 

See an example here.

Saturday, 23 February 2013

GPS elevation graphs

This blog post is a short history on the evolution of GPS elevation graphs on trackprofiler.

When starting the service I created a simple javascript based graph library and used it for GPS tracks elevation graphs:


...but over time, some problems arose. First of all it was slow and rendered in the browser. That means that for slower computers the graphs slowed the rendering of the entire page by more than a second.

And, there was another thing I wanted to show on the graph -- the speed graph. So, a month ago a new version of TrackProfiler was deployed. The graph is now a PNG image created on the server -- no client's CPU is used. The graph, then, looked like:


The green graph is speed, the gray one is elevation.

But, there still was one thing in the evolution of the graph I wanted to make. For example on the GPS track shown -- it started on elevation 197m and never went below. So, it don't make sense to show the vertical  part of the graph from zero. It only makes the uphill and downhill slopes flatter.

After another iteration (online for the last 3 days) -- the vertical part of the graph now starts from the minimum elevation found on the graph. And the uphill/downhill slopes are better visible:


See an example here, or try it yourself on TrackProfiler.

Saturday, 12 January 2013

Gpxpy version 0.8.0

Gpxpy is an open source python library for parsing and manipulating GPX files. It is one of the core parts of the TrackProfiler web site, and one of the open sourced parts of it. In the last few months a lot of work is done. Two new important features:

  • gpxpy can now use lxml (if available) to parse GPX files (contribution from Isaev Igor)
  • Python 3 support (contribution from Robert Smallshire)

...and many more small bug fixes and unit tests to make it faster and more stable.

It is licensed under Apache 2.0 and there should be no problems using it even with your own closed-source commercial apps.

PS. The original trackprofiler utility app and the library used to show analytics graphs (cartesius) are also open source.

Monday, 3 September 2012

Even more GPS editing tools

Even more GPS editing tools are available in the newest version of TrackProfiler. Those are:
  • Remove time metadata from the track,
  • Remove elevation metadata from the track,
  • Elevation graphs are not shown if the track has no elevation data,
  • Move graphs,
  • Add/remove to elevation.
Plus, few bug fixes:
  • Problem with embeding tracks whose subject contain non-ASCII characters,
  • Default background for embeded tracks,
  • Better handling for inbound emails for email track uploading.
Enjoy!

Wednesday, 8 August 2012

Track page load speed

Just rolled out a new update with a an important improvement. The problem was that the track page was generated entirely at the moment you requested it (i.e. you clicked on the link). This is a somewhat slowish process and consequently the page load speed was also slow.

Now parts of the page are cached and the page load speed is improved by 3-4 times.

Enjoy!

Sunday, 22 July 2012

Embeding tracks

This month -- embeding GPS tracks from Trackprofiler in your site. It's easy -- when on the page with your track, just click the "Embed" tab. Then, copy the code on your page. There are 3 predefined widths for widgets, select the one that best fits in your page.

Here is an example of how it looks:


Thursday, 7 June 2012

Export track stats to a CSV file

In the last two weeks I was hiking around my small city (Višnjan). I made a total of 737.96564616 meters uphill, 32575.07452042m long (32680.59386254m if counting elevation).

How do I know those numbers?

Because there is a new option in TrackProfiler -- You can export track statistics in a CSV file. For all files or for files with specific tags. All I did was to export in CSV files with tags "visnjan" and "hiking" and then computing the sum of columns with Excel.

If you tag all your hiking tracks with "hiking", tracks when you were in Italia with "italy" and Alps tracks with "alps" -- just enter "hiking italy alps" in the new CSV exporter form. The resulting file will contain data for all those tracks.

Tuesday, 22 May 2012

Track analytics graphs


With a new version -- one new feature. Graphs for every track uploaded. At the moment, there are three kind of graphs:

  • Graph with elevation and speed,
  • Uphill/downhill ratio,
  • Elevation and steepness heatmap.
I'll probably add more in the future.

PS. The library used or generating the graphs is now open source: see cartesius on github.